Infographic
How much a solar panel system generates across the UK
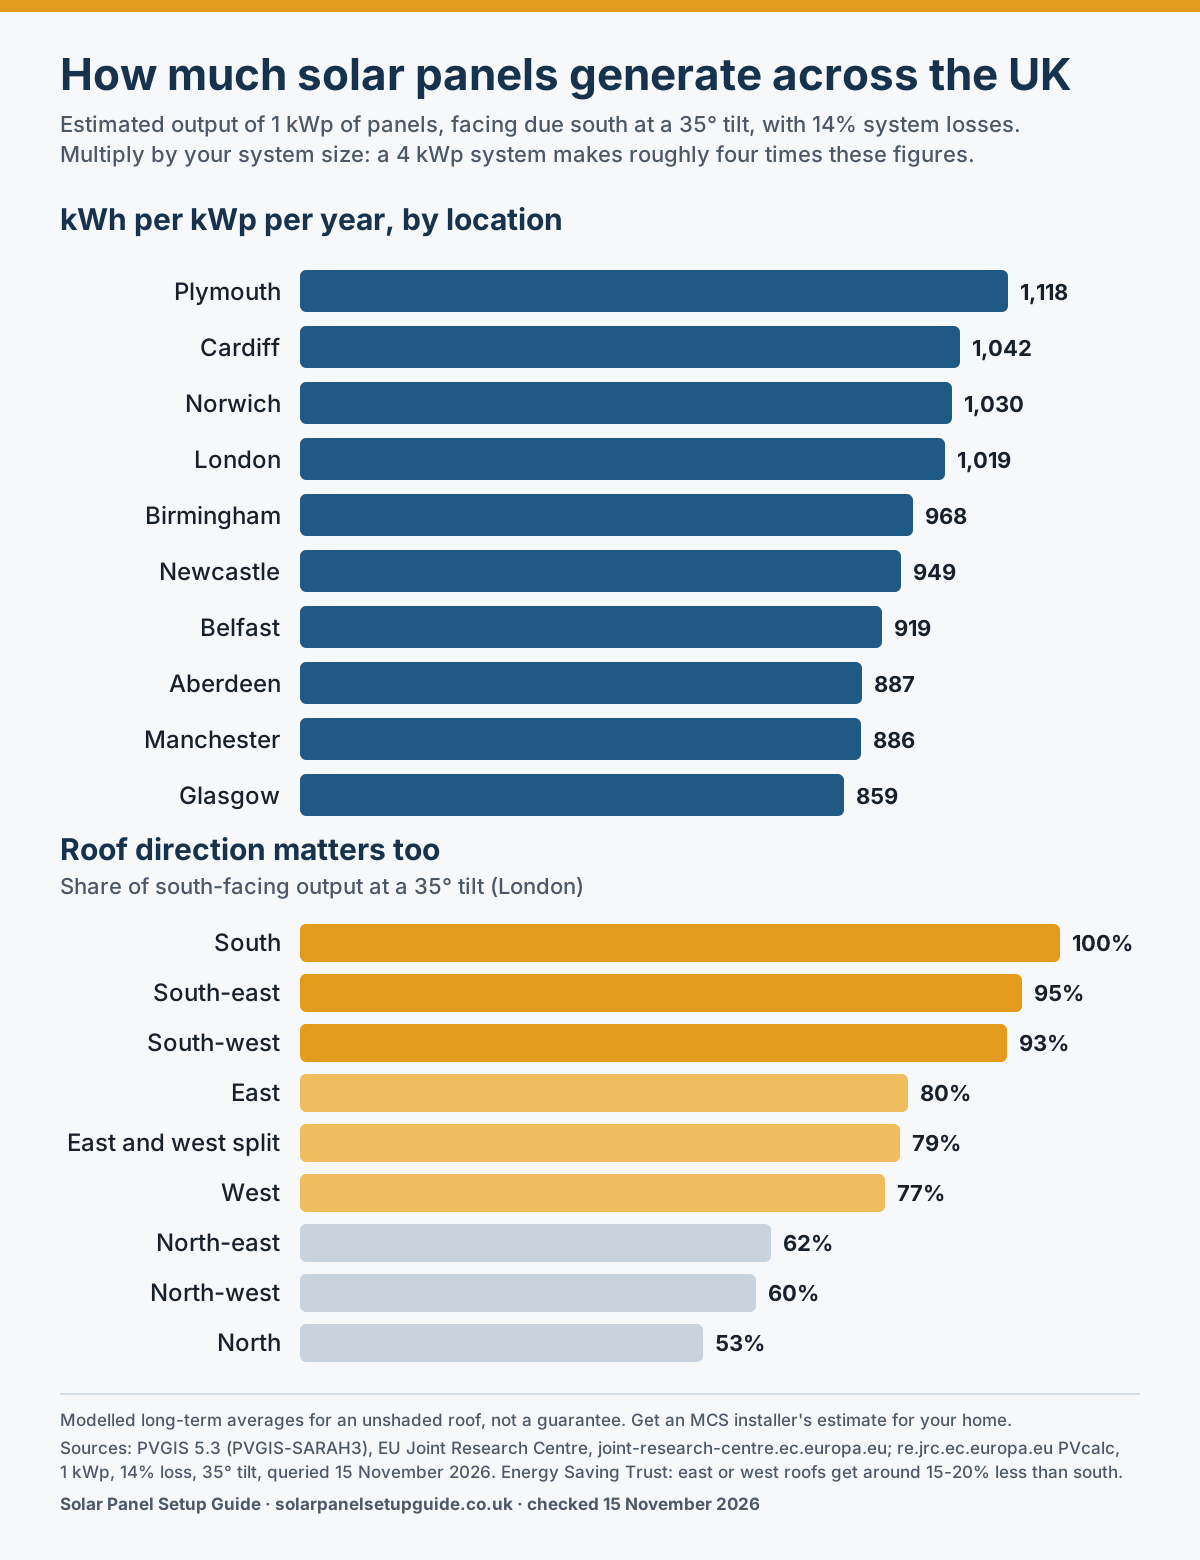
Annual output of a 1 kWp south-facing solar PV system in ten UK locations, and how roof orientation changes it, from PVGIS data checked 15 November 2026.
Text version
Estimated annual output of a south-facing system at a 35° tilt with 14% system losses, from PVGIS. The 4 kWp column is the 1 kWp figure multiplied by four and rounded.
| Location | kWh per kWp per year | 4 kWp system, kWh per year |
|---|---|---|
| London | 1019 | 4076 |
| Plymouth | 1118 | 4472 |
| Norwich | 1030 | 4120 |
| Cardiff | 1042 | 4168 |
| Birmingham | 968 | 3872 |
| Manchester | 886 | 3544 |
| Newcastle | 949 | 3796 |
| Glasgow | 859 | 3436 |
| Aberdeen | 887 | 3548 |
| Belfast | 919 | 3676 |
Orientation, London, 35° tilt, compared with due south:
| Orientation | Share of south-facing output |
|---|---|
| South | 100% |
| South-east | 95% |
| South-west | 93% |
| Split east and west | 79% |
| East | 80% |
| West | 77% |
| North-east | 62% |
| North-west | 60% |
| North (not recommended) | 53% |
These are modelled long-term averages for an unshaded roof, not a guarantee for any year or any house. An MCS installer's estimate for your address is the figure to rely on. See how much electricity solar panels generate in the UK and the sizing estimator.
Embed this infographic
You are welcome to use this infographic on your own site with a credit link. Copy the code below.
<a href="https://solarpanelsetupguide.co.uk/infographics/uk-solar-generation-by-region/"><img src="https://solarpanelsetupguide.co.uk/assets/images/uk-solar-generation-by-region-infographic.svg" alt="Bar chart: estimated yearly output of 1 kWp of south-facing solar panels at 35 degrees, from 1,118 kWh in Plymouth to 859 kWh in Glasgow, plus orientation factors from 100% for south to 53% for north. Source PVGIS, checked 15 November 2026."></a><p>Infographic by <a href="https://solarpanelsetupguide.co.uk/">Solar Panel Setup Guide</a></p>Sources
Opened and checked on 15 November 2026.