Guides · Sizing and generation
How much electricity do solar panels generate in the UK?
Annual output per kWp across the UK from PVGIS, how orientation and pitch change it, and how MCS installers calculate your generation estimate.
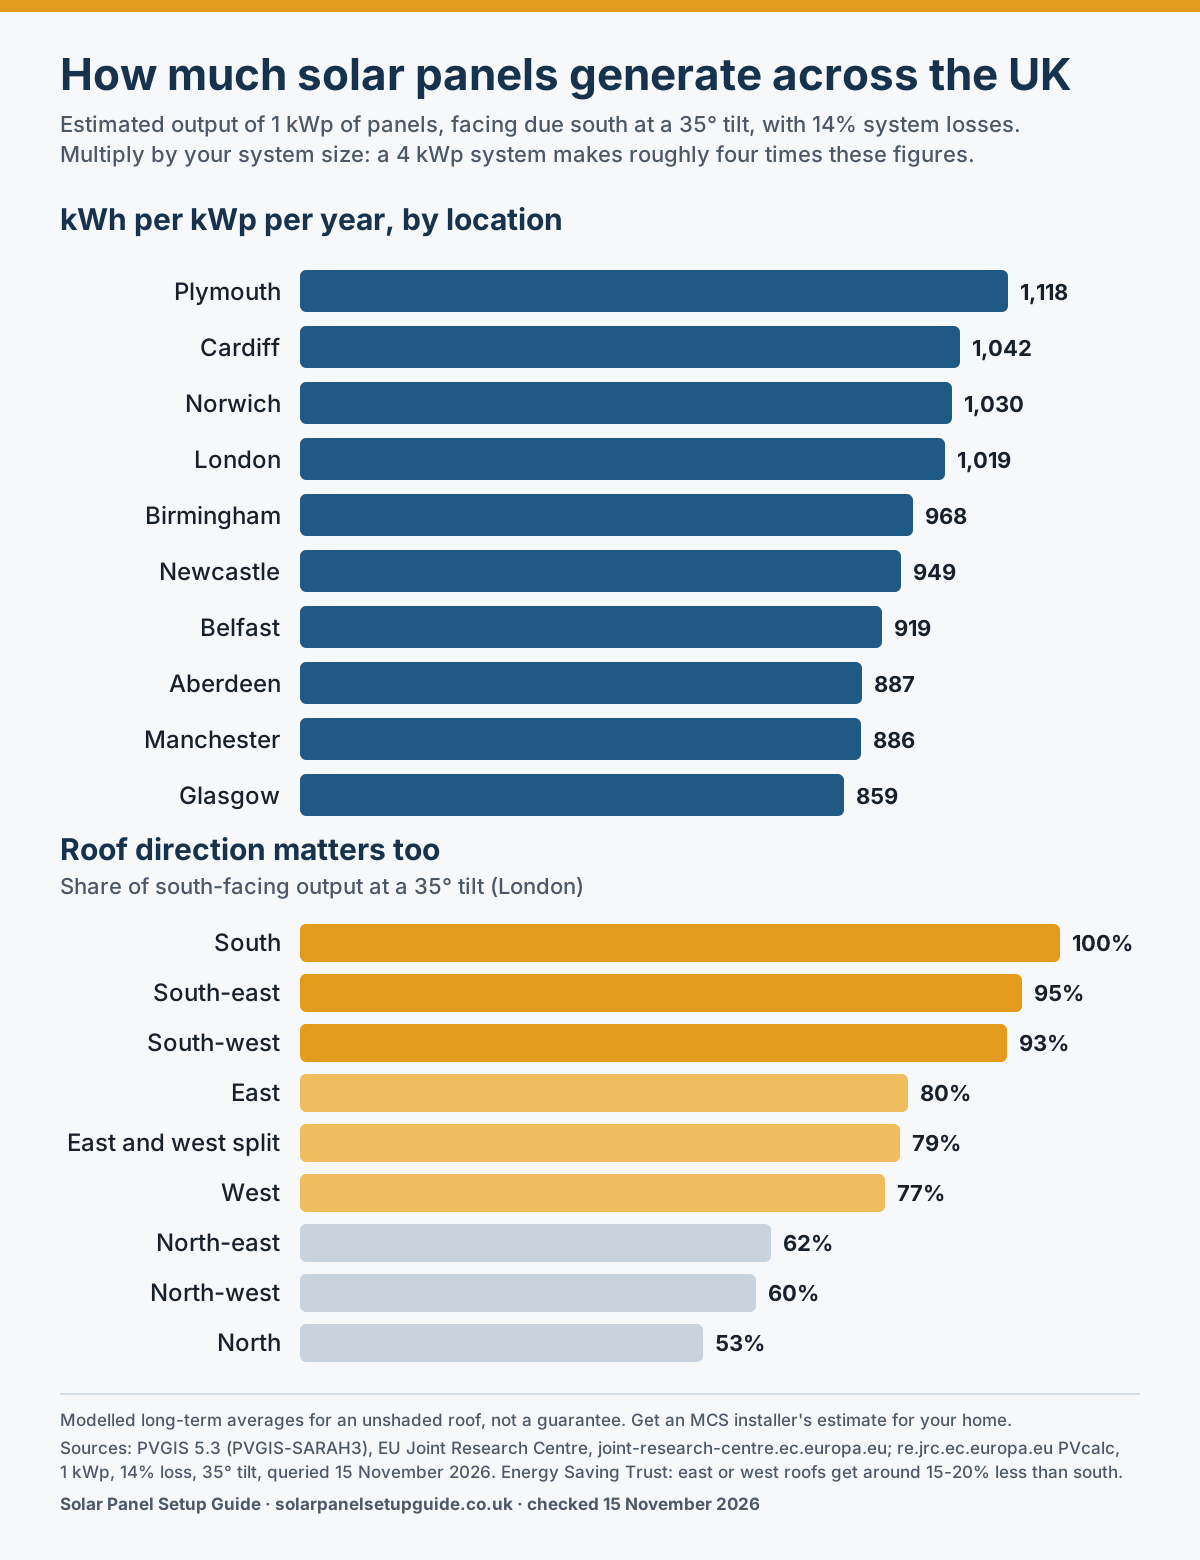
A south-facing, unshaded solar system in the UK typically produces somewhere between about 860 and 1,120 kWh a year for every kilowatt-peak (kWp) of panels, depending on where you live. So a 4 kWp system might generate roughly 3,400 to 4,500 kWh a year. Those figures come from the EU Joint Research Centre's PVGIS model, which we queried for ten UK locations on 15 November 2026. An MCS installer's estimate for your address will usually be lower, for reasons explained below.
Output by location
PVGIS "provides information on solar radiation and photovoltaic system performance for any location, worldwide". We asked its version 5.3 calculator for a 1 kWp system facing due south at a 35° pitch with 14% system losses (cable, inverter and similar). It used the PVGIS-SARAH3 satellite dataset covering 2005 to 2023. Here is an example query for London.
| Location | kWh per kWp per year | 4 kWp system, kWh per year |
|---|---|---|
| Plymouth | 1,118 | 4,472 |
| Cardiff | 1,042 | 4,168 |
| Norwich | 1,030 | 4,120 |
| London | 1,019 | 4,076 |
| Birmingham | 968 | 3,872 |
| Newcastle | 949 | 3,796 |
| Belfast | 919 | 3,676 |
| Aberdeen | 887 | 3,548 |
| Manchester | 886 | 3,544 |
| Glasgow | 859 | 3,436 |
The 4 kWp column is simply four times the 1 kWp figure. The pattern is clear: the south and south-west do best, but even Glasgow produces about 77% of what Plymouth does. Solar works across the whole UK.
How orientation and pitch change output
Direction matters more than latitude for many homes. Our PVGIS runs for London at a 35° pitch gave:
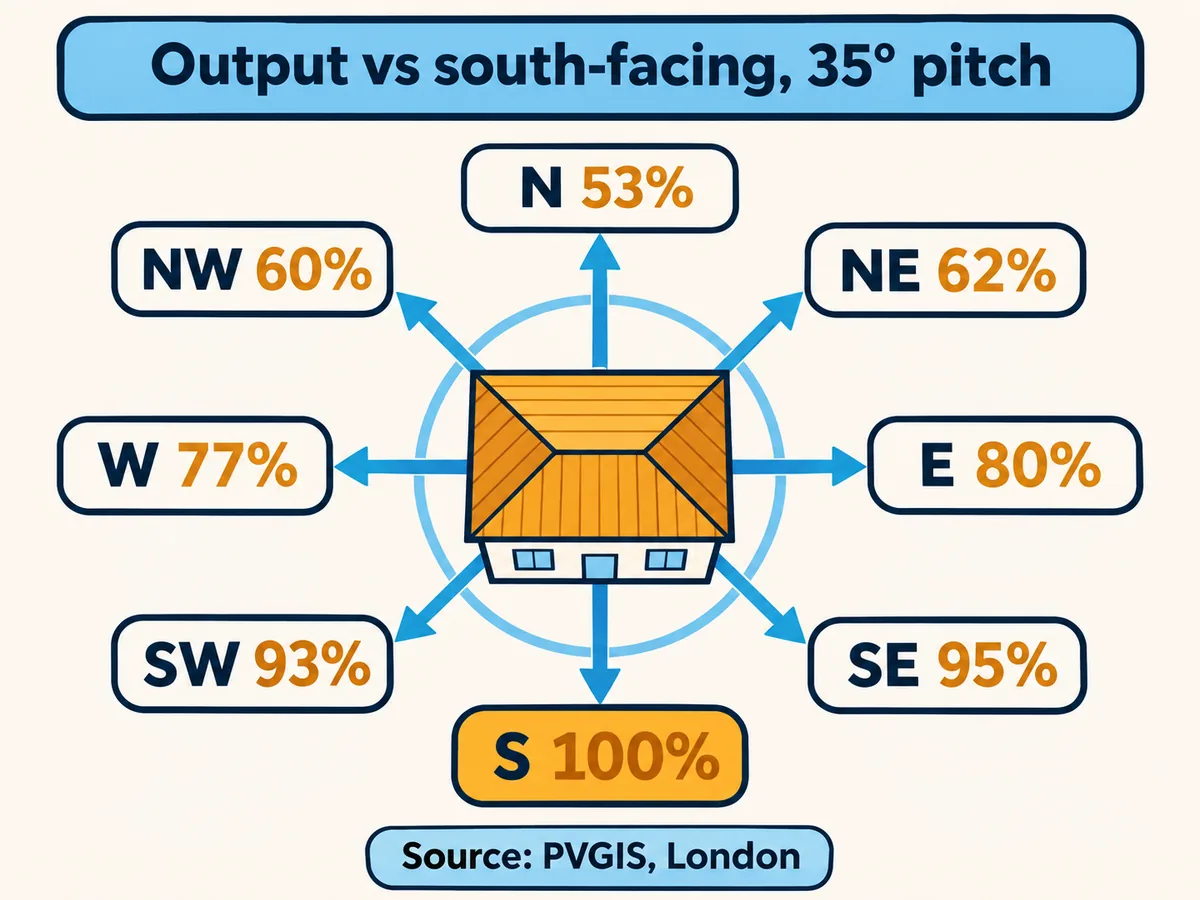
- South: 1,019 kWh per kWp (100%)
- South-east: 969 (95%)
- South-west: 947 (93%)
- East: 818 (80%)
- West: 787 (77%)
- North: 541 (53%)
The Energy Saving Trust says "a system facing east or west tends to get around 15-20% less energy than one facing directly south". PVGIS put east and west a little below that range for London. EST does "not recommend installing panels on a north facing roof".
Pitch matters less. For a south-facing roof in London, PVGIS gave 920 kWh per kWp at 10°, 1,019 at 35° and 1,011 at 50°. Very shallow roofs lose some output, and they also stay dirtier: EST notes that "in the UK, rain will clean your panels if they're tilted at 15 degrees or more".
Why your MCS estimate will be lower
If you get a quote from an MCS-certified installer, the generation figure must follow MIS 3002, issue 6.0, dated 18 March 2026. Its formula is:
Annual AC output (kWh) = kWp × Kk × SF
- kWp is the system's rated size.
- Kk is a yield factor from tables by postcode zone, pitch and orientation. The postcode zones "are the same as the SAP postcode zones", and the standard says the table "data is drawn from the Climate-SAF-PVGIS dataset and multiplied by 0.8".
- SF is a shade factor. With a clear horizon "an SF value of 1.00 used"; with shading it falls, for example to 0.89 in the standard's worked example.
Because Kk is PVGIS-based data multiplied by 0.8, a typical MCS estimate is deliberately more cautious than the raw PVGIS figure. That is fine: under-promising protects you. MIS 3002 also requires a note to customers that the shading method "will yield results within 10% of the actual energy estimate stated for most systems".
Monthly and yearly variation
Generation is concentrated in spring and summer, with much less in December and January. Annual totals also vary from year to year with the weather. PVGIS figures are long-run averages, so any single year could be higher or lower.
Practical consequences:
- In winter you will import most of your electricity even with panels.
- A battery helps most from spring to autumn, when there is surplus to store.
- Comparing your first year's output against the estimate is only meaningful over a full year.
Other things that cut output
- Shading from trees, chimneys, dormers and neighbouring buildings. Optimisers or microinverters can limit the impact, as EST explains.
- Dirt. EST's cleaning guidance says "dirty solar panels can reduce how much electricity solar panels generate", though rain usually keeps pitched-roof panels reasonably clean.
- Heat. Panels are slightly less efficient when hot, which is one reason bright, cool spring days can be very productive.
- Inverter limits. If the inverter is smaller than the panel array, output can be clipped on the sunniest days. Installers size this deliberately.
- Age. Panel makers publish performance warranties; for example, LONGi and Trina guarantee around 87 to 89% of rated output after 30 years on the datasheets we opened. See best solar panel brands.
How to check your own figure
You can repeat our method for your address. Open PVGIS, choose the grid-connected calculator, click your location on the map, enter 1 kWp, 14% losses, your roof pitch and your roof's azimuth (0 is south, -90 is east, 90 is west), and read the yearly output. Multiply by your planned system size. Then compare that with the installer's MCS figure, remembering the MCS method is designed to be more conservative. A big gap in the other direction, where a quote promises much more than PVGIS, is a warning sign worth questioning.
Turn generation into savings
Generation only becomes money when you use it or export it. The EST solar calculator gives an independent estimate, and our estimator lets you change every assumption.
Try the numbers for your own roof: the solar sizing and savings estimator turns roof area, orientation, region and electricity use into a kWp range, a generation estimate and an indicative payback range, with every default sourced.
Next steps
- Work out how many panels you need.
- Check whether solar is worth it at today's prices.
- Download or embed the UK generation infographic.
Sources
Opened and checked on 15 November 2026.
- https://joint-research-centre.ec.europa.eu/photovoltaic-geographical-information-system-pvgis_en
- https://re.jrc.ec.europa.eu/api/v5_3/PVcalc?lat=51.51&lon=-0.13&peakpower=1&loss=14&angle=35&aspect=0&outputformat=json
- https://mcscertified.com/wp-content/uploads/2026/03/MIS-3002_Solar-PV-Systems-V6.0-Final.pdf
- https://energysavingtrust.org.uk/advice/solar-panels/
- https://energysavingtrust.org.uk/tool/solar-energy-calculator/
- https://energysavingtrust.org.uk/solar-panel-cleaning-maintenance/